How can we timely inform policymakers, when rigorous impact evaluations are long in coming?
In a paper published last year in Social Science & Medicine, we provide an estimate of the potential impact of the covid pandemic and related policy responses on global multidimensional poverty. We use information available at the onset of the pandemic to inform simulations run on just under 100 survey datasets. Simulations for nationwide closures of primary schools, for instance, are relatively easy to implement. One major challenge of any such approach is, however, that only very few of those datasets are contemporary and actually refer to 2020 or even 2019. In order to address this problem, we develop a model for translating the simulated shocks from the survey year to 2020, which we then combine with nowcasts of our poverty indices obtained from customised projection techniques.
In fact, many other development indicators face a similar situation in terms of their data. In particular, the Demographic Health Surveys (DHS) and the Multiple Indicator Cluster Surveys (MICS), which are our prime data source, are also popular for monitoring several indicators of the Sustainable Development Goals (e.g., forms of malnutrition or drinking water access). As these datasets are usually updated every 3-5 years and making these datasets publicly available also easily can take 1-2 years, the current year is rarely available. As a consequence, these micro datasets may not reflect the most recent progress of the last few years and, therefore, micro simulations based on that data are also potentially misleading.
Moreover, when shocks such as the covid pandemic strike, clear-cut policy recommendations based on rigorous evidence are not yet available. The required studies (e.g., on the efficacy school closures in curbing the pandemic) which have to be carefully designed, executed, peer-reviewed and published are at best in the making. Likewise, various aspects of the shock itself (e.g., epidemiological characteristics of the pandemic and how they evolve over time) are not yet well-understood. Notwithstanding, policymakers are required to reach timely decisions, calling in turn for timely policy advice. Indeed, policymakers may actually face similar situations more frequently, although usually less dramatic. An estimate of a potential impact of the shock and related policy responses offers a sense for the order of magnitude.
Our approach to combine micro-simulations and projections techniques, using a translation model is in principle applicable to both other development indicators and different shocks. Therefore, I briefly explain in this blog entry, the basic ideas underlying the approach we adopt in this paper.
First, we estimate the global Multidimensional Poverty Index (MPI) as usual for some 100 countries using the most recent micro datasets (the majority being provided by DHS and MICS). The global MPI is a multidimensional poverty measure building on 10 deprivation indicators which are aligned with the Sustainable Development Goals (SDGs). Reported key indices include the headcount ratio $H$ (the proportion of poor people in the population), the intensity $A$ (the average deprivation among the poor) and the adjusted headcount ratio $M$, which is the product of $H$ and $A$. To facilitate the presentation, this blog entry refers to whatever is more convenient (the paper, however, covers the entire analysis separately for $H$ and $M$).
Subsequently, we run simulations directly on these micro datasets which include the deprivation indicators of the global MPI (e.g., indicators for child mortality, undernutrition, school attendance) at the individual level. The scenarios we simulate are informed by data provided by UN agencies. Specifically, based on UNESCO data we assume every second child attending school to stop doing that and based on data of the World Food Programme (WFP) and the assumption that observed food crisis translates into undernutrition, we derive risk parameters for our simulations.
Simulations are a powerful device as they may account for numerous aspects embodied in micro-data, such as socio-demographic distribution of a population (including, e.g., household size, the age distribution, educational achievements). Additionally, and of particular relevance for our case of multidimensional poverty, the micro-data also provides information about how deprivations overlap with each other (i.e. the joint distribution of deprivations). Naturally, one challenge of such a simulation-based analysis relates to the choice of the underlying parameters, (i.e. who is how likely to experience the shock) which is, however, not the focus of this blog entry.
Another challenge is that the micro-data on which the simulations are run may be outdated, which is problematic for at least two reasons. First, poverty may have reduced further since the last data has been collected. Second, the simulated shock might have been different if run on a contemporary survey for the same country with, say, lower poverty (or a different joint distribution of deprivations more generally).
To address the first issue, one could simply simulate and nowcast and then just add the shock to the nowcasted value. This approach, however, would ignore the second issue and is problematic if the shock itself depends non-linearly on the initial level of poverty (or the development indicator under consideration). Indeed, there are several reasons why to expect such a non-linearity. One reason is that together with the level of multidimensional poverty the joint distribution of deprivations or relevant socio-demographic characteristics of the population may have changed over time as well. Another reason is the bounded nature of the underlying variable (in a country where every member experiences already the maximum shortfall in the welfare variable, poverty cannot increase), which may, for instance, lead to relatively small increases near the upper bound.
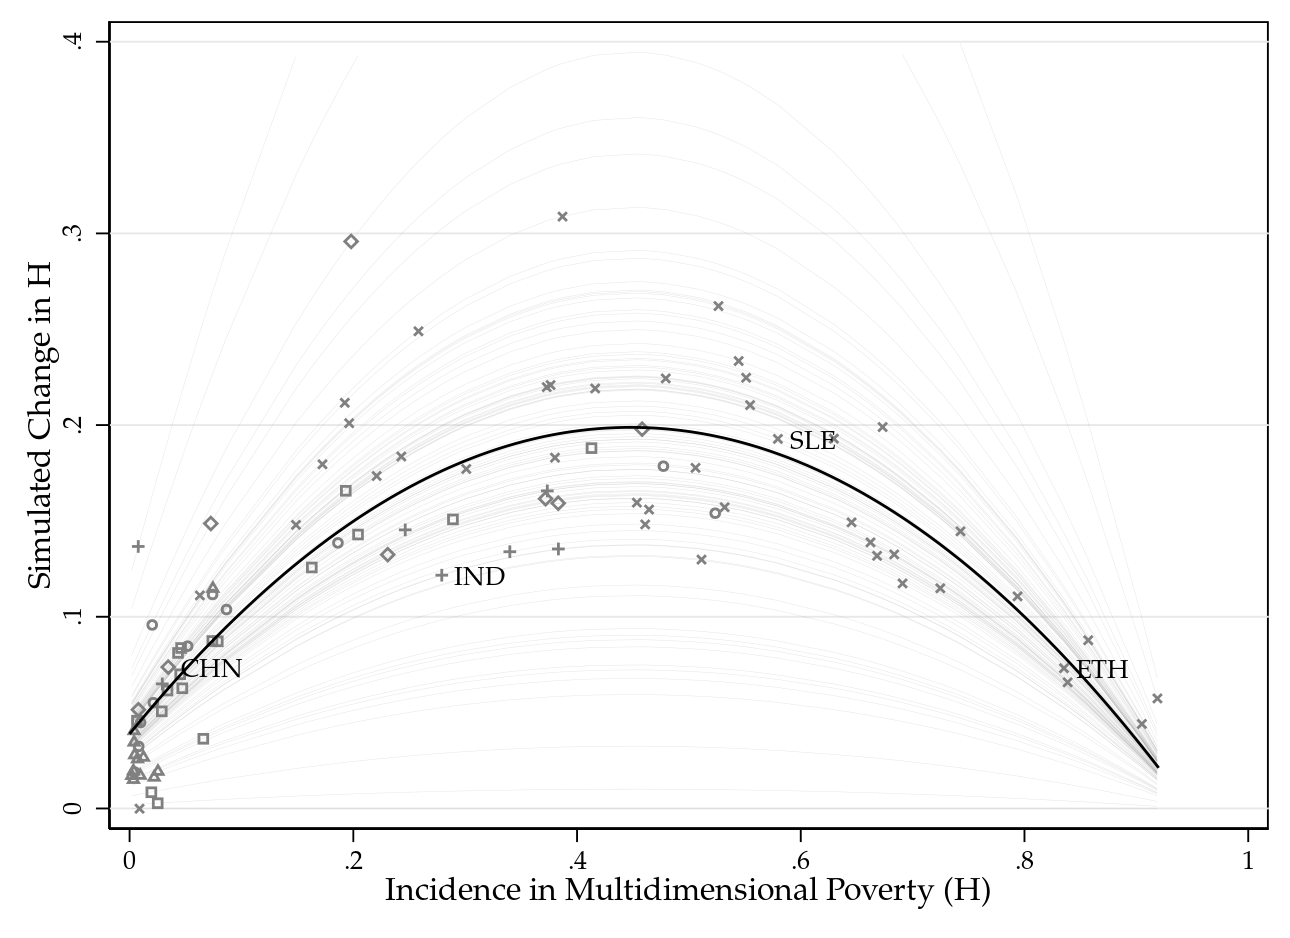
Indeed, for multidimensional poverty the data inspection reveals clearly a non-linear relationship between the level and the simulated shock. More specifically, figure 1 above plots for all countries the simulated change of the headcount ratio against the level of the headcount ratio as observed in our data. Figure 1 clearly suggest a quadratic relationship.
Therefore, in our approach we proceed as follows. After performing the simulations on the most recent micro data for each country we use global MPI estimates for previous rounds of data to obtain poverty trajectories for each country, including a value for 2020, the nowcast. For this exercise we use customised projection techniques designed for our multidimensional poverty indices (which ensure $M$, $H$ and $A$ to be consistent with each other and their respective upper and lower bounds to be respected).
Then we fit a cross-country model which explains the change due to the simulation (= the simulated shock) with levels of multidimensional poverty. Essentially, this model can translate the shock in multidimensional poverty simulated in the most recent survey year to the current margin taking into account changes of multidimensional poverty during this time span. Thus we call it the translation model for short. So plugging in the nowcasted values into the translation model allows us to predict a simulated shock for 2020.
Note that the predictions of the simulated shock for each level of $H$ are also shown in figure 1 (the solid black line). Revisiting figure 1, however, also reveals substantial cross-country variation around the solid black regression line. India, for instance, seems to experience a rather low shock given its headcount ratio of multidimensional poverty (perhaps due to its already relatively high deprivation rate in nutrition). To account for such a heterogeneity we introduce a scaling factor computed as multiplicative residual term into our model which allows to calibrate the model for each country. Graphically, we then obtain a hump-shaped line for every country (running through each countries' simulated shock, see also figure 1). We use this calibrated translation model for predicting the simulated shock (based on the nowcasted levels of multidimensional poverty).
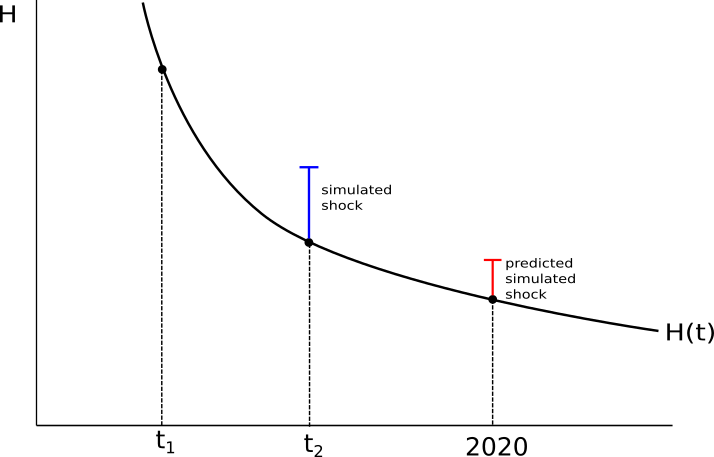
Figure 2 below illustrates the interplay of simulations, projections and the translation model for the case of the headcount ratio of a single country. For each country we observe the headcount ratio $H$ in two years ($t_1$, $t_2$). For the simulation exercise we use the most recent year ($t_2$) which gives the change in $H$ due to the shock (blue bar). Using customised projection techniques we obtain the $H$-trajectory of a country (the black line $H(t)$), which includes the nowcasted value of $H$ in 2020. The translation model is estimated using the $t_2$ data for all countries. Plugging the nowcasted values (black dot in 2020) into the translation model gives finally a predicted simulated shock (red bar) for this year (and level of $H$). Note that the predicted simulated shock (red bar) may well be different in magnitude from the simulated shock in $t_2$ (blue bar).
Having the simulated shocks translated to 2020 for each country, we can finally aggregate across countries using population weights to arrive at global figures. Our results suggest additional 547 million people to experience multidimensional poverty and a setback in global poverty reduction of almost one decade.